The more I learn about being successful in day trading, the more I see that it comes down to working with data. You can’t just copy someone else’s strategy and trade according to someone else’s rules. If you want to be consistently profitable, you have to create those rules for yourself from scratch. This way, they will fit your personality type and your unique style of trading.
I mentioned that my best winning strategies hold true 60-70% of the time in previous blog posts. How do I know that?
To answer that question, I have to pull up the tickers that I’ve traded using that strategy. But how did I chose to follow that trading strategy to begin with? Originally, I had to do research and collect the stock market data. Of course, this is a complicated and lengthy process. But to give you a brief overview, these are the main steps I take:
- Develop a working theory.
- Collect enough data to confirm or disprove my thesis.
- Refine my process and adjust the strategy based on the new data and new trades.
Since I often trade multiple setups, I have to track each strategy separately to determine if it works. I use Google Sheets for my system. Microsoft Excel will do exactly the same thing for you if you prefer it.
By now, you must be imagining the amount of time and effort that this system takes. I’m not the most analytical person out there, and I certainly don’t love spreadsheets. But I love day trading, and to me, it’s worth learning a new skill and developing a new habit to trade better. Having a tracking system in place helps you make informed decisions. Without it, you are just gambling. With it, you are day trading like a professional.
Before we proceed, it’s also important to note that there’s no one right way to track your trades and strategies. Again, we’re all different, and there are multiple ways to track and analyze data. It has to work for you, so I encourage you to learn about several different systems before settling down on one particular method. And of course, you can tweak it as you go, adding what’s missing and removing the parts that aren’t as important for you.
Basically, I’m trying to test a new trading theory and see if it has an edge to it. I’ll need to collect the data from the market, cross-reference it, and see if there’s a correlation.
So this is how I track my data, described step by step.
Let’s say that I want to see what happens if a stock is up 10% or more in comparison with the previous closing and has an earnings report come out. Maybe, there’s some kind of common pattern that I can trace and use to my advantage.
First, I list all tickers that match my thesis and dates when the conditions above were met. Again, you can go into details as much as you’d like. I’ve seen some highly detailed tracking systems where you can add a link to the said report or specify the numbers from it. Starting with a binary yes/no tab is a good start, and you can always narrow it down later with EPS (earnings per share) or balance sheet specifics, trying to find another correlation there.
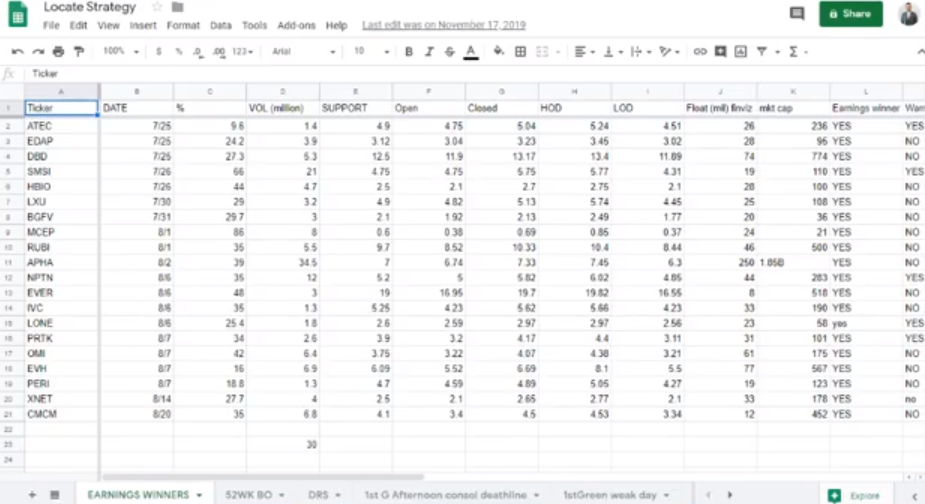
So let’s take one ticker as an example to show you how it works. EDAP gapped up 24.2% on July 25, 2019. The volume was 3.9 million shares. As with any trade, multiple important factors influence it, and volume is one of them.
I also track the Open, Close, and Support level numbers, as well as the High of the day (HOD), the Low of the day (LOD), market cap, and the float. I also have another simple yes/no tab for news and warrants since I’m a short seller.
I also track the same data for day 2. If you’re a swing trader, it makes sense to track a week or even two weeks worth of data for the same ticker. And if you trade pre-market, you should have the pre-market info. It all depends on your style and the way you’re used to reading the data you’ve gathered.
At first, having all this information is overwhelming to say the least. Over time, you start seeing patterns in the way different tickers move. But the more you watch the market, the more you understand what happens and, most importantly, why it happens.
For example, if I like to buy into the close and I see that the open price is below the close price, why would I keep doing that? Once I see that this pattern repeats time after time, I’d rather buy the dip and then ride the spike up.
If I do everything right and I still don’t find an edge, maybe my criteria are too broad. Otherwise, sometimes I just need to look at more information and cross-reference it with what I already have.
The more data you track, the stronger and more representative it is. Of course, it doesn’t always include the context, such as what happens right after the market opens. Does it dip right away, how long does it take to rotate the float, were there any squeezes, which part of the day did the stock reach HOD and LOD?
That’s why you should always pair this analysis with regular chart reading to fill in the missing context, and you’ll see how boring numbers transform into deep understanding and knowledge. Now you have a feel for how each ticker performs, and they all have their own characteristics.
Now, it’s important to mention that no theory is 100% correct. However, that doesn’t mean that they won’t be profitable. Some strategies are only true 30% of the time, but they have a huge risk/reward advantage. Personally, it’s not my thing, but I know some people who are amazing at trading these setups. For me, I prefer strategies that work more than half of the time and fit my risk/reward scenario.
Now that you have a developed strategy, you can start testing it on your paper account or with real money. Of course, you might need to tweak some things or narrow down some criteria as you go. In any way, you’re miles closer to having a well-researched profitable day trading strategy than you were before you started this process.
Data talks, and it’s your job as a day trader to listen and analyze it. You don’t need to record literally everything that happens, but tracking the most important factors will give you a sense of confidence in what you do. Once you find the common denominator or a culprit of why a ticker moved the way it did, you’re not guessing anymore. You know what happens and why it happens. And the next time it happens live, you’ll be able to recognize it and trade it well.
Hopefully, this post is helpful for all beginner traders out there and those who are still in search of a working tracking system. Day trading is relatively easy once you have the system in place. But of course, you have to learn a lot to get to that point.
Many traders talk about winning strategies and rock-solid trading plans, but you don’t see people go into detail about developing them very often. That’s why I decided to share my process and explain how you can customize it for yourself.
And if you have any questions, please feel free to ask them here in the comment section or below my podcast episode on Youtube.
Comments Off on How To Track Winning Day Trading Strategies?